The work of the The Morton Arboretum’s Chicago Region Trees Initiative is driven by an extensive range of data about the region’s tree canopy. Data have been mapped in a variety of ways to reveal and highlight relationships between the distribution of the region’s trees and other factors.
These data and maps are presented for use by decision-makers in local governments and other agencies, community groups, nonprofits, and all others concerned with trees.
Canopy Counts Program
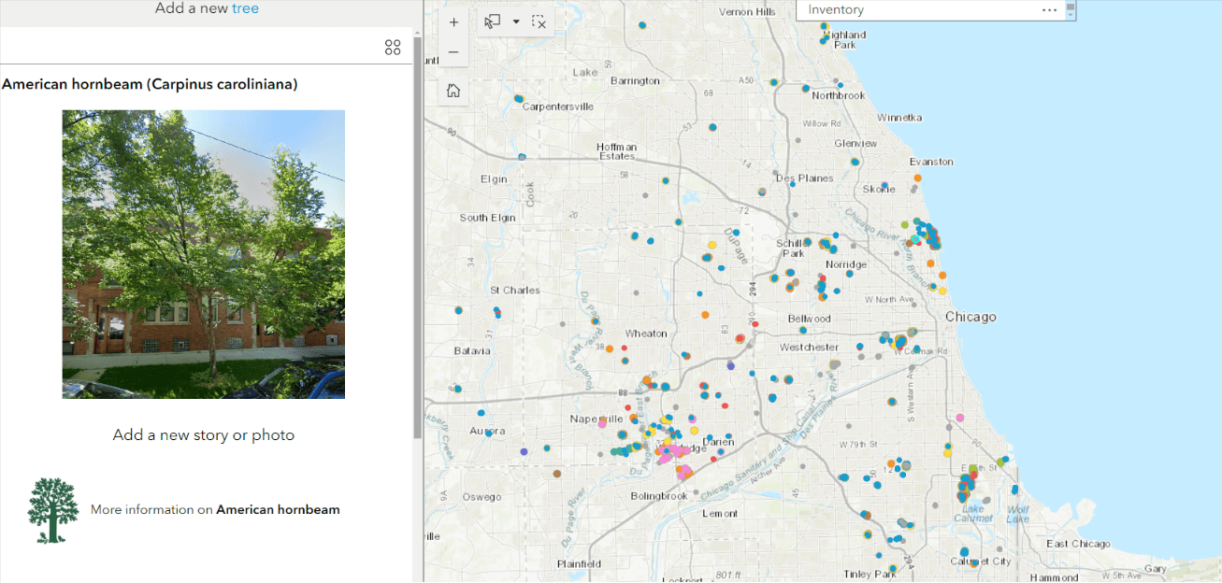
The Canopy Counts Program provides a simple and fun tool for residents to help their communities track trees and tree-ready spaces across the Chicago region, while learning more about the benefits provided by those trees.
You can view an interactive map to find trees that have already been added through the Canopy Counts Program. Each species is represented by a different color.
Information added about your local trees will help CRTI, your local government, and community organizations understand how best to care for trees so they provide the most benefits for our neighborhoods.
Chicago Region Tree Census
The Chicago Region Tree Census serves as a strategic guide for local and regional stakeholders to understand current trends and make informed decisions about how to protect and improve the forest to benefit residents and communities.
In 2020, The Morton Arboretum partnered with Davey Resource Group Inc. and the Student Conservation Association to conduct its second Chicago Region Tree Census, remeasuring 1,576 plots in the city of Chicago and the seven surrounding counties of Cook, DuPage, Kane, Kendall, Lake, McHenry, and Will to gain a comparative snapshot of the regional forest and the benefits it provides.
In 2022, Arboretum researchers compiled and analyzed data from each of the seven counties in the Chicago region: Cook (not including the city of Chicago), DuPage, Kane, Kendall, Lake, McHenry, and Will.
View the census report and read about its key findings.
CRTI Priority Maps
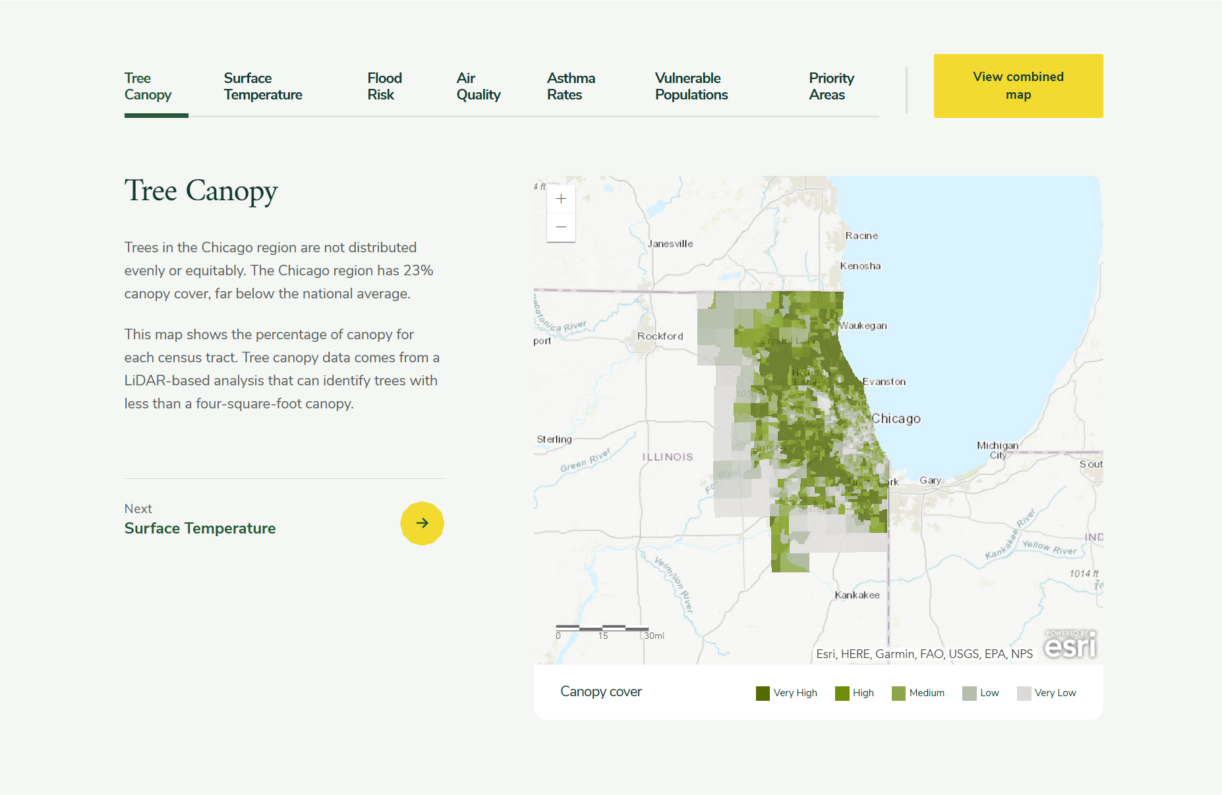
To identify where trees are needed most urgently, CRTI created Priority Maps by combining canopy cover, surface temperature, air quality, flood risk, health, and social vulnerability data into the map layers into combined, interactive map layers.
Community Tree Canopy Summaries
Community Tree Canopy Summaries show the tree canopy cover, plantable space, and types of land use for communities in the seven-county Chicago region.
Each report provides data showing the multiple benefits that trees provide people and compares those data to similar communities. The data and visualizations in each report can support efforts to protect trees and guide tree management plans for your community.
You can use an interactive map to find your community or find your city or county from the list of community areas to download your community’s summary report.
Map of Shrubby Invasive Plants in the Chicago Region
This map from the CRTI and Purdue University’s Digital Forestry Initiative models where shrubby invasive plants are located in the Chicago region and labels whether the lands where these plants are found are private or public.
Access the interactive map.
Using this map, conservation efforts and removal plans can be coordinated with local landowners to help manage the spread of invasive woody plants and shrubs.
Oak Connectivity Map
Oak trees and the ecosystems they support are a critical part of the ecology of the Chicago region. Oak trees are keystone species that support a large diversity of plants and animals. Oak woodlands provide habitat for wildlife and, when connected in large areas, provide corridors for animals to migrate and ecosystems for them to thrive.
To help restore and enhance oak ecosystems, the Arboretum’s Chicago Region Trees Initiative and the Chicago Wilderness Alliance created the Oak Connectivity Map that identifies where oak ecosystems remain, identifies cores (the most important ecosystems to protect and restore), and maps corridors and buffers that protect and connect these cores.